✿ Last updated: 21 Jul '26 ✿
Domain
Sustainability Tech
Duration
1.5 Years
Lythouse is a purpose-built ESG platform (by Zycus, a global procurement leader) empowering enterprises to track emissions, meet compliance, and achieve real sustainability goals.
Team: UX Designer (Me), (5) Product Managers, Head of Product, AVP
Led the project for 1.5 years (2023–24), Designed multiple modules, solving UX challenges, refining the Design System for consistency and scalability, and exploring AI to enhance usability and automate workflows.
It Builds long-term trust by proving responsible practices through transparent, data-backed reports.
Protects from financial and legal risks by ensuring compliance with global sustainability norms.
Drives smarter growth by spotting inefficiencies, saving costs, and enabling sustainable innovation.
80% of Investor
Planned to incorporate sustainability into their investment decisions.
50% of Consumer
Said (sustainability is) extremely important today as it builds trust.
To build a powerful, AI-driven ESG platform that’s intuitive for business users, robust for data analysts, and scalable for enterprise needs, all while turning complex sustainability data into clear, actionable insights.
I audited the existing research, identified gaps, and reframed the problem from a UX lens, then mapped it against target audience and business context to validate our direction.
Target Market
Lythouse was originally built for large enterprises facing rising ESG reporting demands, where 10,000+ global companies must track and disclose emissions. It first focused on sustainability teams, procurement leaders managing thousands of suppliers, and compliance and finance executives.
The platform was later revamped to support end-to-end ESG execution across Scope 1–3 emissions and regulatory frameworks at enterprise scale.
Business Problem
Large enterprises found it extremely difficult to track emissions and sustainability progress across Scope 1–3. Data was spread across departments, supplier networks, and manual spreadsheets, making it hard for teams to produce reliable, audit-ready reports.
Sustainability, procurement, and compliance leaders needed a simpler way to meet rising regulations and manage ESG performance at scale.
I refined key user groups by clearly mapping their pain, consequences, and needs making insights simpler, more practical.
Admin
Pain:
Managing users, permissions, data sources manually is slow, confusing, and time-consuming.
Consequences:
Weak access control, delayed approvals, security risks, and poor decisions.
Need:
Centralized control, bulk actions, quick approvals, and reliable data for faster decisions.
Business User
Pain:
Tracking expenses and emissions is complex, slow, and hard to review.
Consequences:
Low visibility, slow decisions, inaccurate reports and
missed optimization opportunities.
Need:
Real-time insights, easy corrections, and quick approvals for smarter decisions.
Auditor
Pain:
Reviewing large data and approvals manually is repetitive and time-consuming.
Consequences:
Delayed audits, missed errors, compliance risks, and reduced trust.
Need:
Smooth workflow to review, comment, and approve with clear tracking.
ESG Analyst
Pain:
Managing supplier data, emission factors, reports is complex and error-prone.
Consequences:
Inaccurate disclosures, delays, compliance risk, weak sustainability insights.
Need:
Simple tools for data capture, supplier management, reliable ESG reporting.
🕹️
Control & auditability: Admins and Auditors needed traceability and approval gates at every step.
⚡️
Speed & clarity: Business Users and ESG Analysts needed fast, simple workflows with no friction.
With 5 PMs and modules shipping in parallel, we followed an approach, (kept it dynamic) adapting per module based on what each challenge needed. Some required deep discovery, others moved straight to rapid iteration with engineers. The design system kept everything consistent despite the pace.

The product is built around three key features: Account, Comply, and Transform. We designed each feature as a flow that fits into one ESG system.
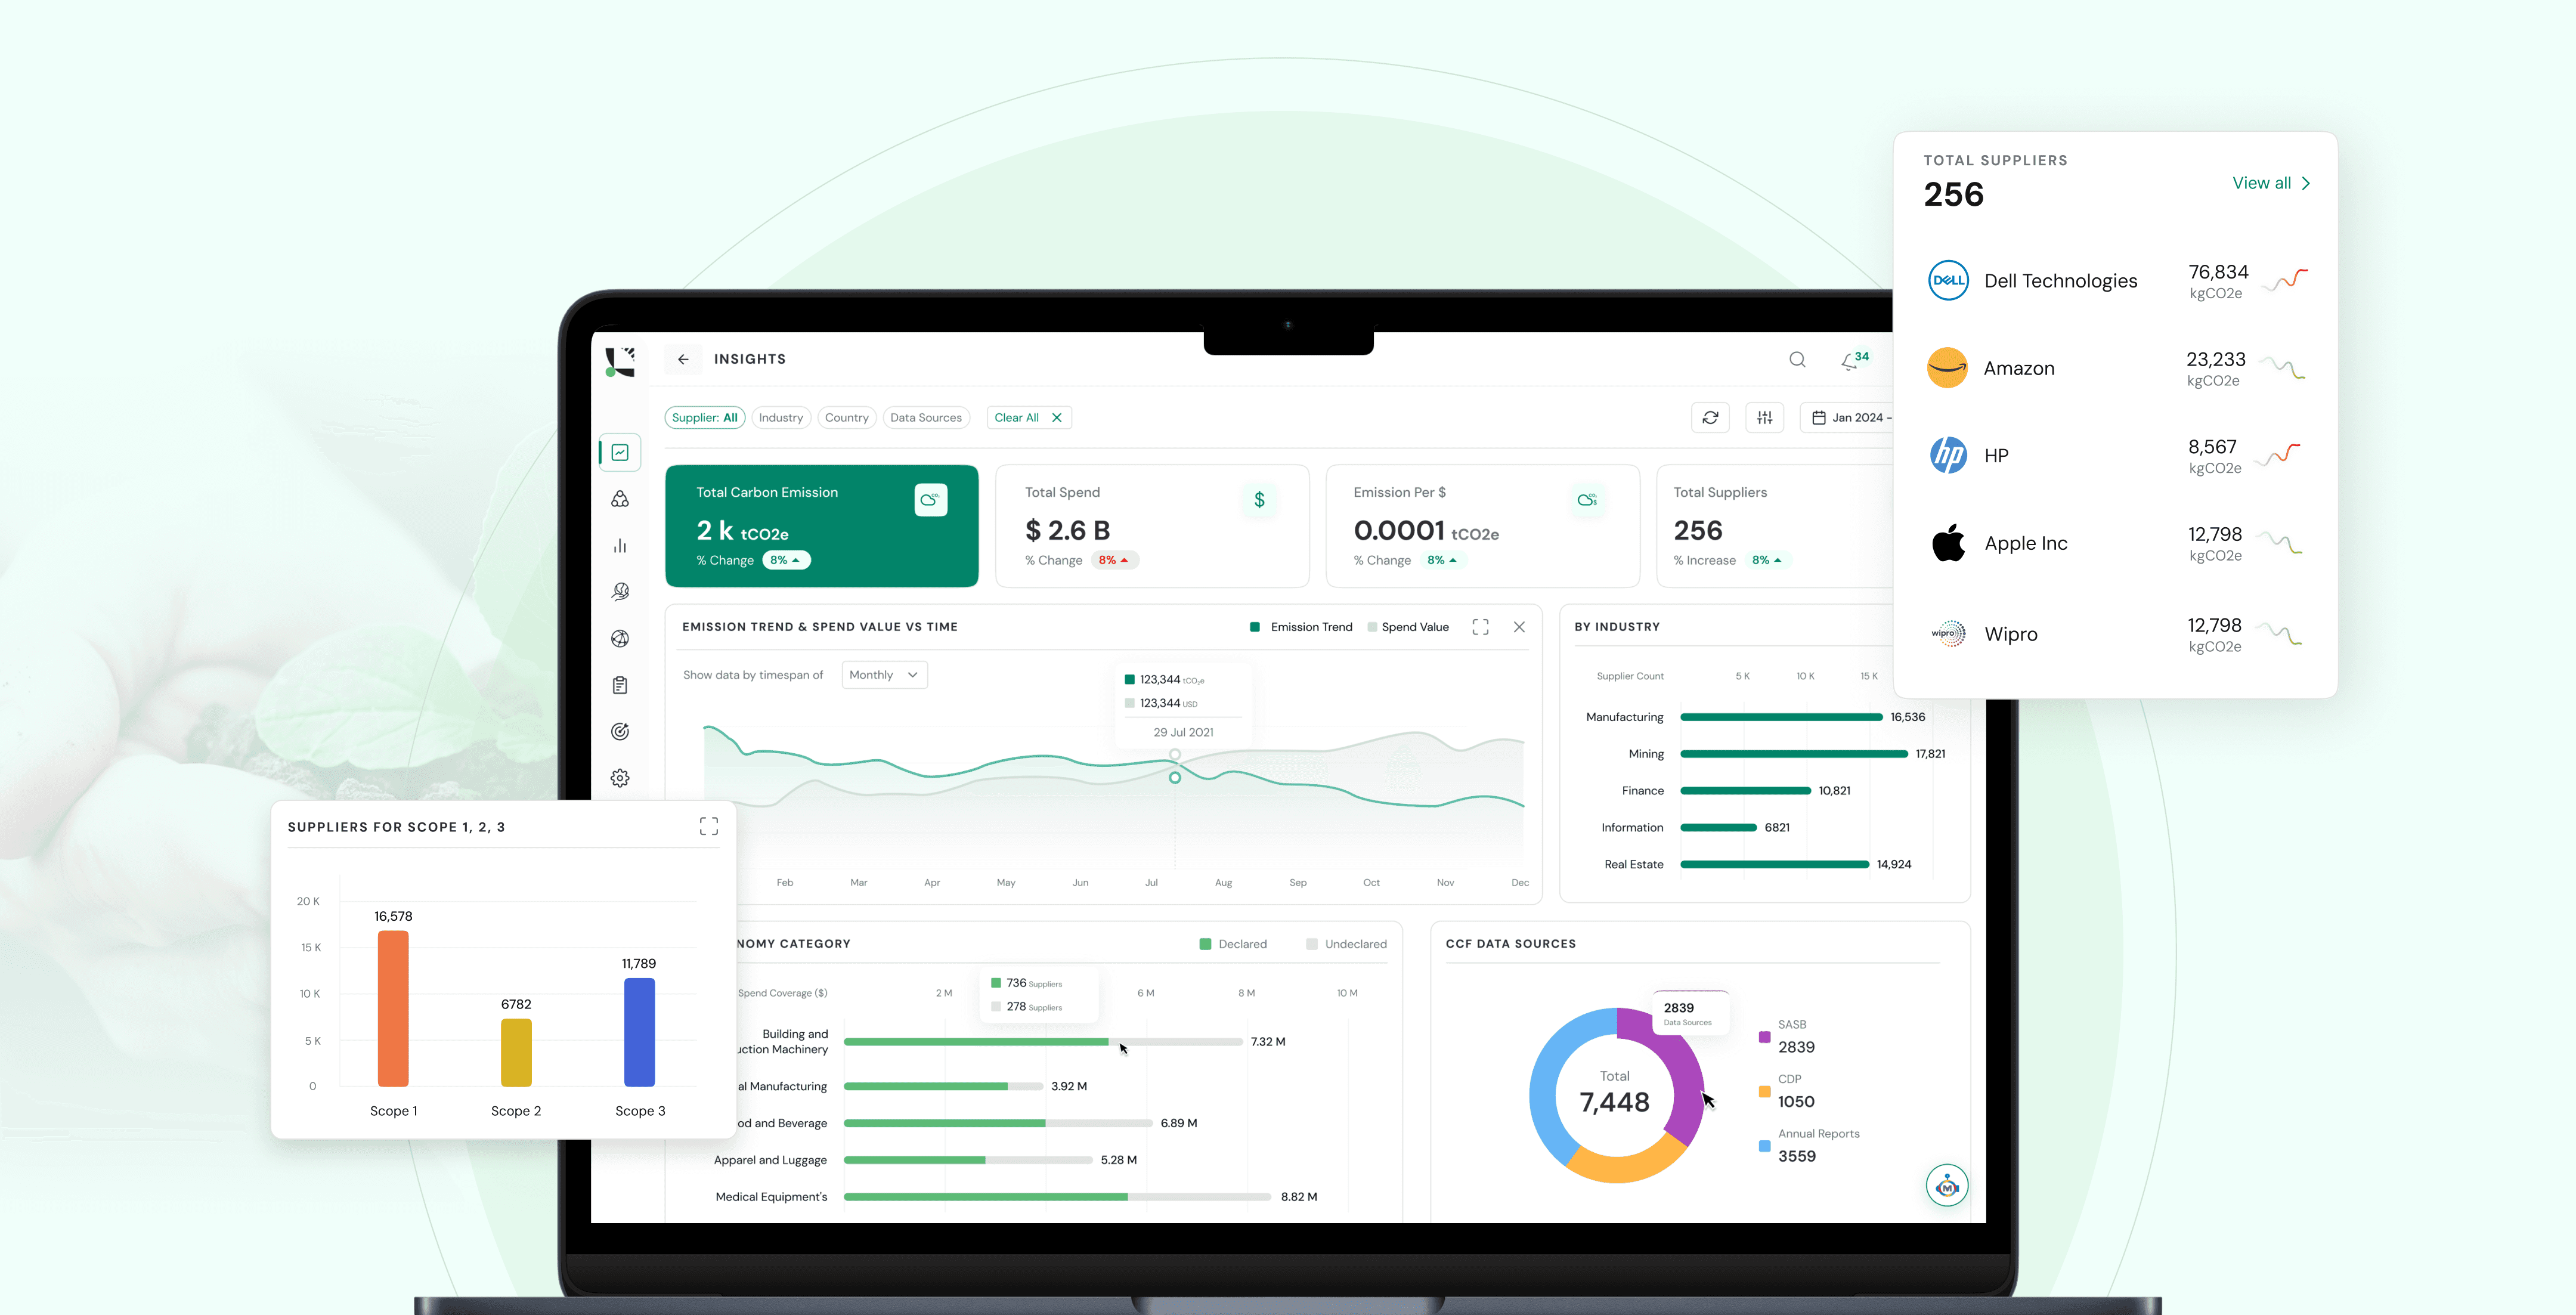
The core challenge was making carbon data feel trustworthy, not just readable. We added source attribution and data confidence indicators so users knew exactly where each number came from before acting on it.

🔴 Scope 1, 2, and 3 each contain multiple categories. Across a large platform, users were losing track of which category belonged to which scope.
✅ I color coded each scope consistently across the entire product. Every category inside Scope 1 always looks the same, everywhere it appears, In data review, dashboards, and reports. One glance tells you where you are.
🔴 Users couldn’t understand how emission factors were mapped or which source was being used, reducing trust in automated results.
✅ I surfaced mapping logic through inline info states and a detailed side panel showing source priority, coverage, and matching breakdown.
Most ESG reporting tools dump everything into one long form. We restructured it as a guided, section-by-section flow, reducing cognitive load and cutting report completion time significantly.

🔴 Reporting involved multiple layers (sections, disclosures, topics, questions), making it difficult to track progress and manage answer creation across workflow.
✅ I introduced a persistent side panel showing progress, pending items, and topic status, combined with in-context comments, easy navigation, and AI/past-response support to streamline answer creation.
🔴 Audit logs showed fragmented entries like “edited” or “updated,” making it hard to understand all changes performed within a single session.
✅ I grouped actions into collapsible activity blocks with a clear change summary, while providing a detailed view on the main page to help users quickly scan and deeply inspect edits when needed.
Goal-setting in ESG is meaningless without progress visibility. We designed the Goal Navigator to show current state vs. target at a glance, with AI-suggested milestones so teams always knew the next concrete step.
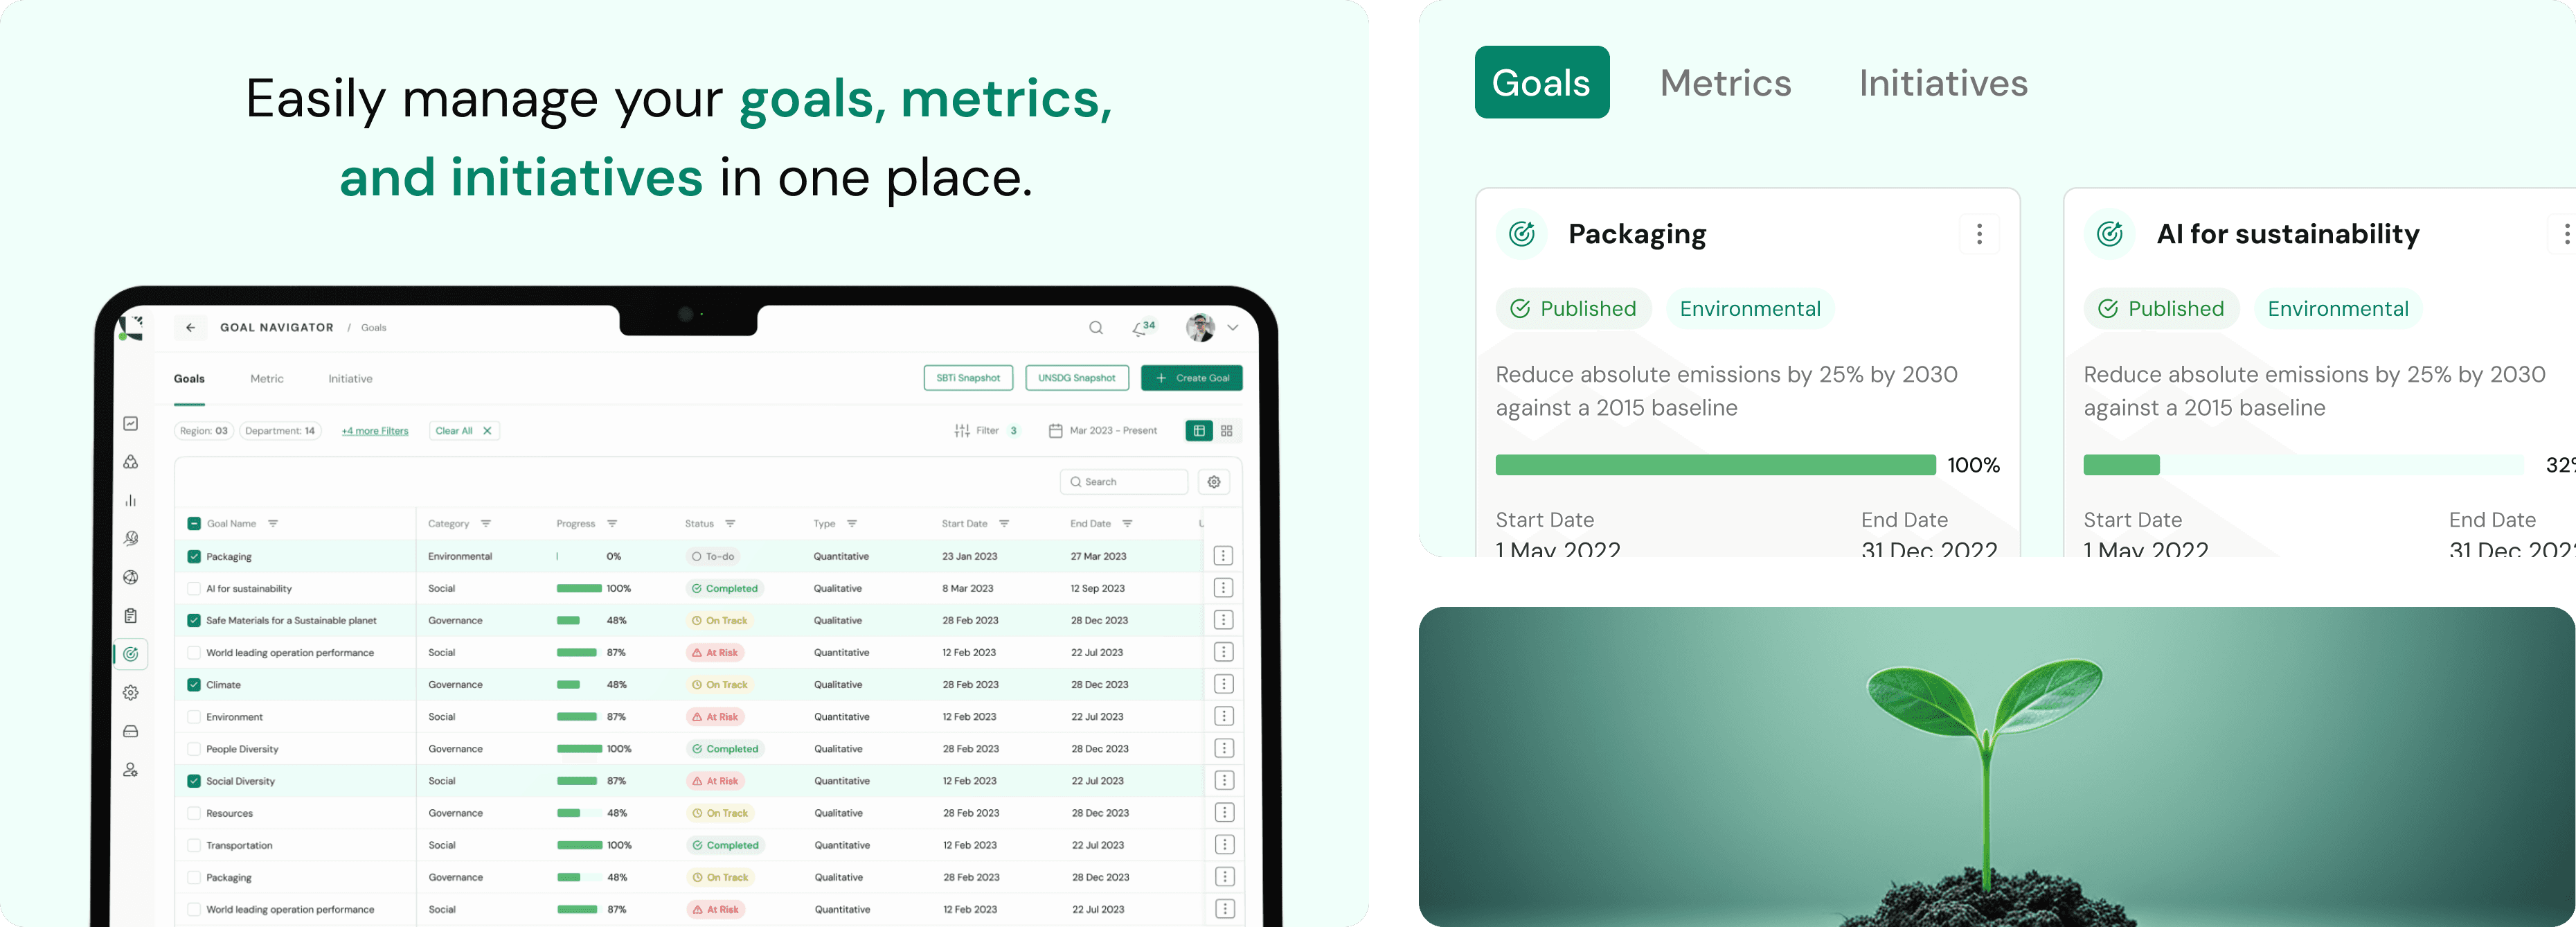

🔴 Users lacked clarity on how to define and track ESG progress at a company level, as measurement, targets, and actions were disconnected.
✅ I unified metrics, goals, and initiatives into a single system, enabling users to measure performance, set company-level targets, and track execution in one connected flow.
🔴 Users couldn’t understand how metrics were calculated or how they impacted goal tracking, making the system feel opaque.
✅ I introduced a “View Formula” action on each metric and enabled formula definition during creation, giving users clear visibility and control over how their metrics work.
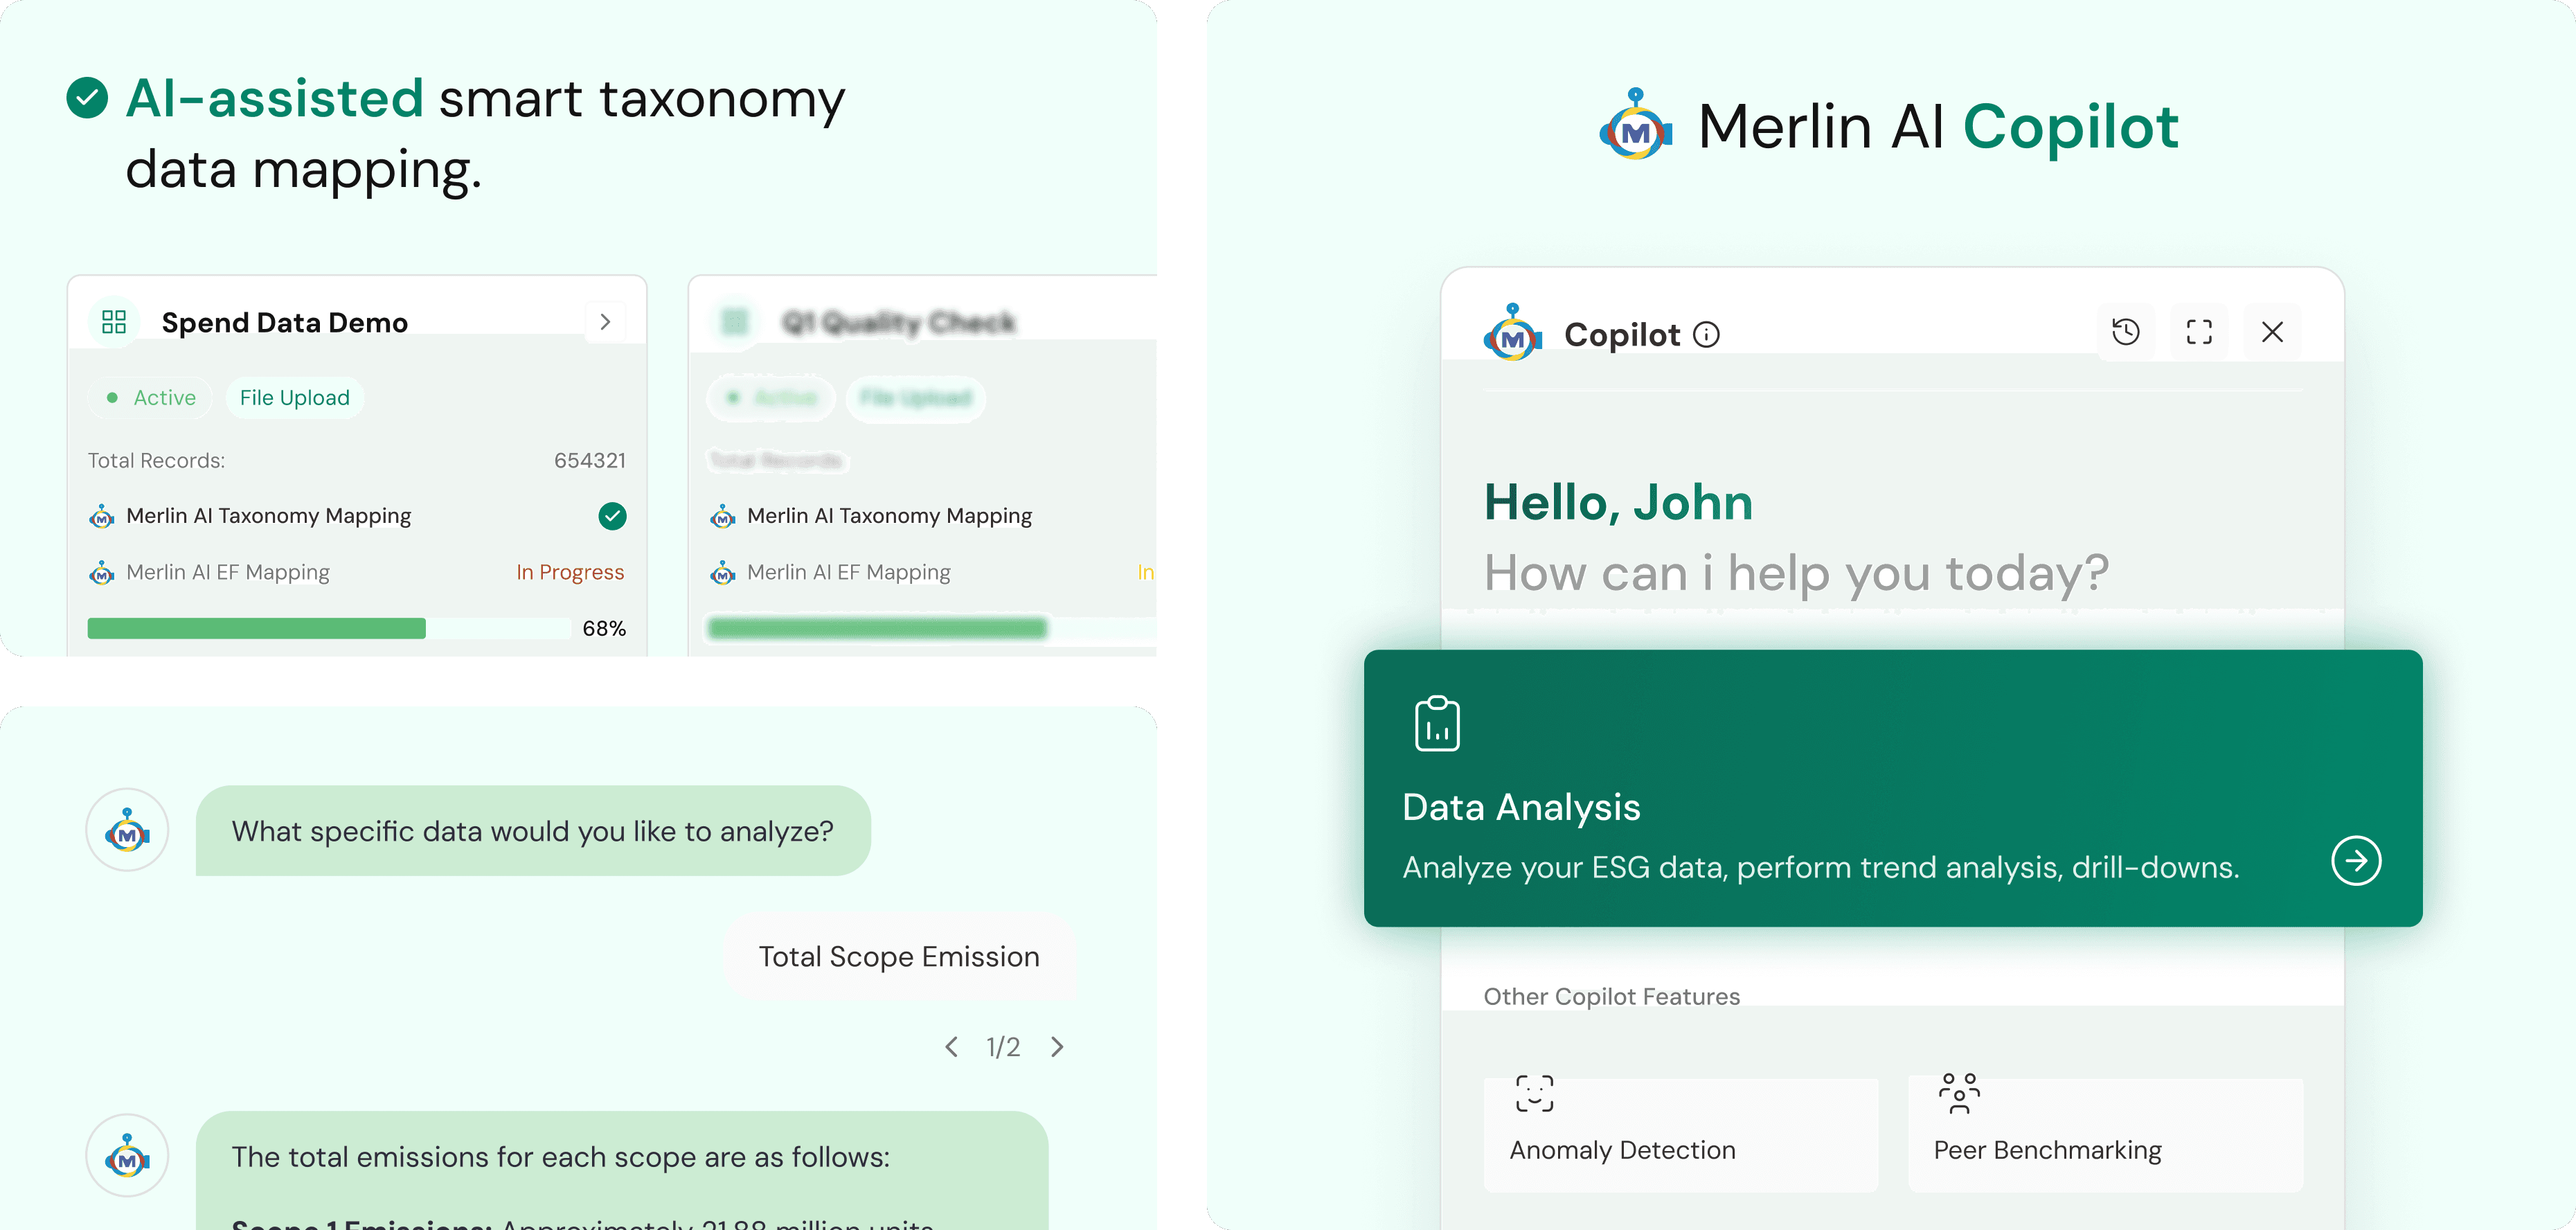
We designed Merlin AI to feel like a silent teammate. Built into every corner of the platform, it auto-maps data, suggests ESG goals, speeds up reporting, and answers questions in real time.
I built a scalable, evolving design system with reusable components across modules, speeding up work and reducing Storybook rework.

Lythouse had multiple modules, each needing different cards. To reduce dev effort, I designed a master card, a flexible base that powers all other cards across the platform.
Motion credit: Kunal Lokhande @Feelpixel
✅
• Improved reporting efficiency by 50–60%, reducing time and friction across workflows.
✅
• Contributed to a 20–30% increase in user retention through improved UX.
This project taught me many things, but these are the top three I value most.
From Vision to Execution
Working closely with P&D team taught me how ideas turn into real outcomes, balancing vision with practical limits and ensuring the work actually ships.
Designing with Constraints
I learned how to design when timelines were short and resources were limited, and to create effective solutions within real constraints.
Navigating Complexity
Learned to stay adaptable when priorities shifted, processes evolved, and conflicts arose handling challenges calmly while keeping progress moving.
Lythouse has been one of my most significant project. This case study offers only a brief glimpse into it. If you’d like to know more, feel free to connect at amandzn.work@gmail.com.